Introduction
The sport of ultra-marathon running is one of the fastest evolving sports on the globe. Races of 100 miles or more are becoming normalized, prize money is skyrocketing, and sponsorship dollars are flooding in. Each year more and more people are lacing up a pair of trail running shoes. An ultra-marathon is defined as any foot race longer than a traditional marathon: 26.2 miles. Some of the most common ultra-marathon distances are 50 kilometers, 50miles, 100 kilometers, and 100 miles, but races in excess of 500 miles exist. While the label of ultra-running relates only to distance, the races are primarily held off the road on hilly trails. A global sport, regions like France and Colorado hold some of the largest and longest standing races. However, new races are being founded every year in the United States and around the world. While the sport’s explosion in popularity is relatively recent, ultra-athletes have been existing on the fringes of society and competing in ultra-marathons since the 1800s. No longer existing on the fringes in 2025 companies like Nike and Adidas are pouring billions into the sport.
As of 2022 the global trail running shoe market was valued at $7.3 billion. This value is expected to grow to $13 billion by 2032. Each shoe company is scrambling to gain control of the market. In-depth information and analysis of what was once a niche activity is now becoming necessary for fortune 500 companies. By analyzing decades of results from thousands of races insight can be gained into the secrets of ultrarunning. These insights may lead to the creation of the shoe that finally gives someone control of the $10 billion dollar industry. Perhaps analysis enables the signing of an undercover athlete who is primed and ready to become the next big thing. In addition to product creation, marketing, and sponsorship insight, analysis of ultrarunning data impacts an even larger industry: gambling. As the sport continues to grow, and fans increase into the hundreds of millions large gambling platforms have joined the scene. Fans can now place bets on their favorite athletes in the biggest of races and gambling organizations require every scrap of data they can manage.
To glean valuable insights into the world of ultra-running this project will apply a range of data analysis techniques to multiple relevant datasets. In conjunction with every current race record available data has been gathered through multiple APIs. This additional information includes weather, elevation, and location data. By integrating multiple data streams, a clearer picture of ultra-running trends can be developed. Through the application of unsupervised machine learning techniques, including unsupervised methods such as Principal Component Analysis (PCA), clustering techniques, Association Rule Mining, valuable insights into the history and the future of ultra-running performances will be derived. The analysis covered in this project will uncover trends and patterns within the sport. More specifically, clustering techniques such as K-means, Hierarchical, and DBSCAN can categorize athletes based on performance similarities, revealing trends among elite runners and amateur participants. Furthermore, Association Rule Mining discovers hidden relationships between race conditions, athlete characteristics, and finishing times. Through this process, valuable information and prediction capabilities will be available to inform corporations, race organizations, athletes, and fans alike. This analysis will return exciting results from a sport full of exciting results!
In addition to the application of classic unsupervised machine learning techniques, this project will implement multiple supervised machine learning models. The following will apply Niave Bayes, Support Vector Machines, Logisitc Regression, and Decision Trees to teach models to correctly classify race results. For each of these approaches 80% of the data will be segmented into a training dataset with which to teach the model. The remaining 20% of the data will be allocated to the test set. Once the models have been trained using the training dataset they will be fed and asked to classify the test dataset. Through this process model predicative capabilities can be accurately assessed to ensure optimal performance when receiving new data. These models will be extremely useful for classifying incomplete data. As many races around the world are still “grassroots” incomplete data collection is an unfortunate reality. Often results may be posted piece meal or be missing valuable race or athlete categorizers. Through the application of the supervised predictive machine learning models explored in this analysis, a more comprehensive and informative dataset can be established.
This project’s predictive analysis will be then further enhanced by the introduction and application of ensemble learning. Machine learning ensemble learning aggregates multiple models and or predictions to make a final classification. This approach reduces the risks of model biases and can greatly enhance model performance. The application of ensemble learning will further enhance the power of this project and the assessments ability to be relevant to the greater ultra-marathon community. As such, this inclusive dataset will then be much more powerful when examining sport-wide trends! This project will effectively lay the foundation for the data science and machine learning future in the sport of ultra-running. As the sport continues to progress and grow the ability to understand complex race data and make accurate predictions will become increasingly valuable to stakeholders. Increased awareness to the value of such analyses will create an intellectual positive feedback loop. Valuable data insights will promote improved data collection enabling future more powerful insights. This project is merely the beginning of the long-overdue introduction of machine learning insights into the sport of ultra-running!

Gender Questions
How has advances in the sport impacted performance disparities between male and female athletes?
Are there certain distances where women perform comparatively better than men?
How does this relationship change when considering all competitors, not just the elite athletes?

Age Questions
What ages perform best over various distances? It is often claimed that endurance peaks in ones 40s.
How does running races at a young age impact longevity in the sport?
Prediction Questions

Weather Questions
How does race temperature impact race results?
What temperatures are most conducive to fast times?
For races over 24 hours how does hours of sunlight impact finishing times?
Can we accurately predict race results given key variables?
Given athlete previous performances how accurately can we predict performance in a ‘hypothetical’ race?
How fast is the sport growing and evolving? What will the race landscape look like in 20 years?
Exploratory Data Visualizations


The above figure shows the number of Ultra-marathon events held each year. The graph displays large growth, particularily in the past 10 years.

The above pie chart displays the top 10 most common ultra-marathon distances. Unsurprisingly, 50km, 50mi, 100km, and 100mi are the top 4 most common distances.

The histogram (above) provides a visual representation for the total number of athletes from each age category competing in ultra-marathons. Athletes in their 40’s are the most common athletes represented in such races.

The above graph provides a visual representation for athlete average speed given their age category and the race distance. Athletes in their 30s appear to perform consistently better than other age groups across many distances.
This figure shows the number of athletes finishing Ultra-marathon events each year. The graph displays a very similar trend (to left), exhibiting rapid growth.
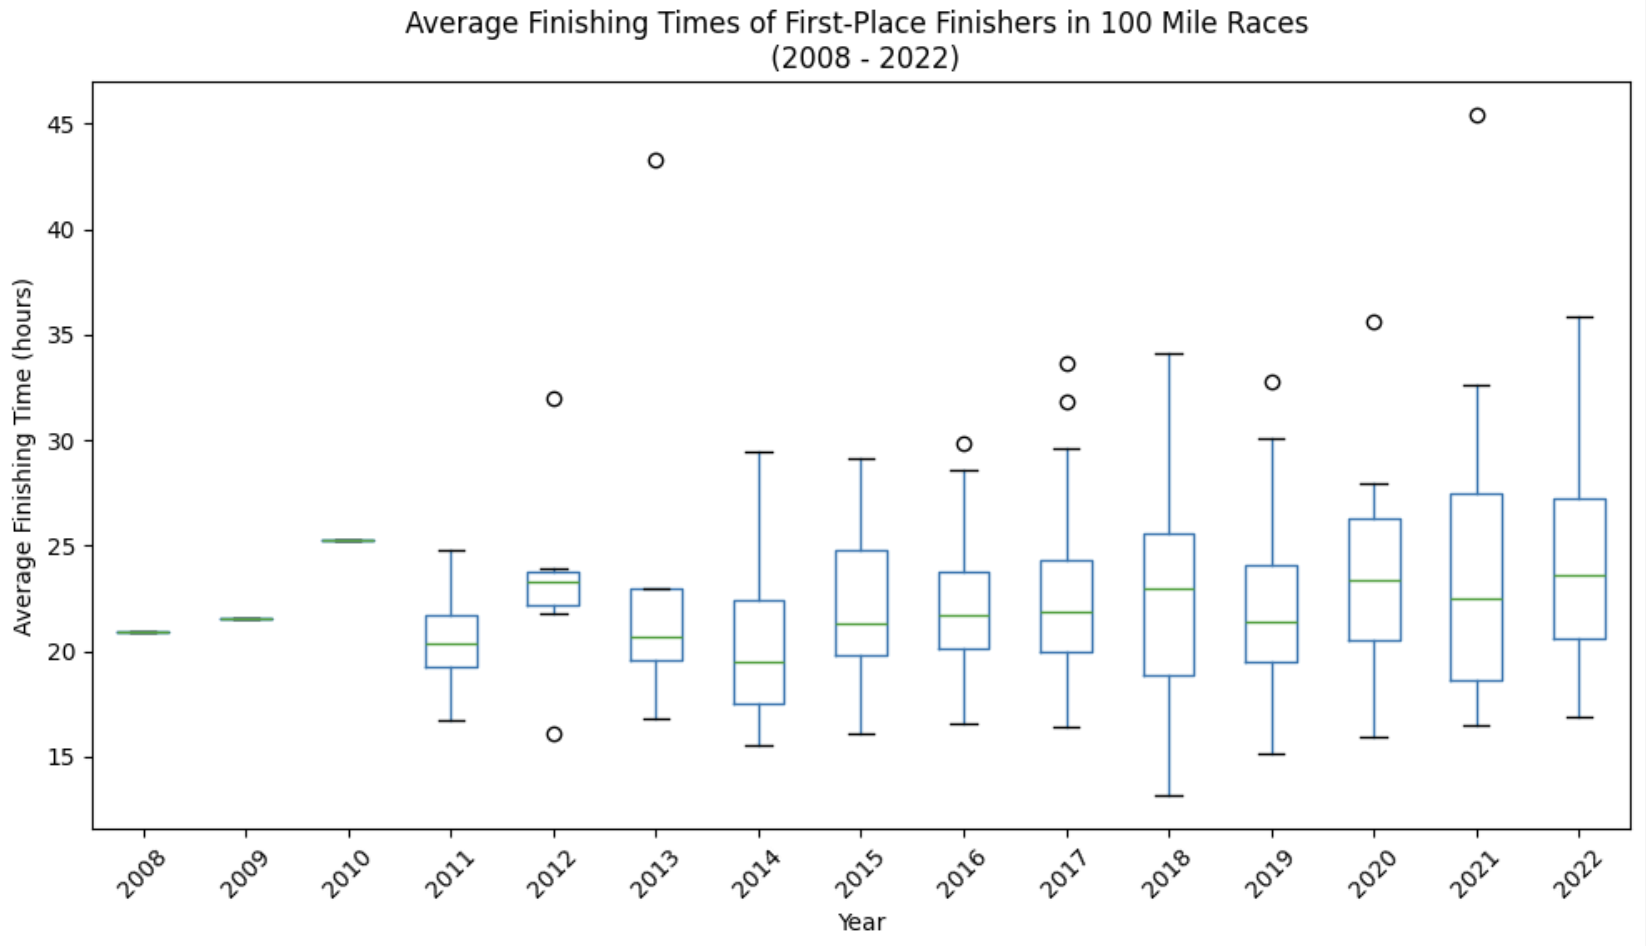
The above boxplots represent the average first-place finishing times for all 100 miles races in a given year. While, there is more variety - likely corresponding with more races - the times do not appear to be changing drastically.

The above plot displays the average speed gap between male and female first place finishers (male speed - female speed). The difference is decreasing, modern female athletes are performing comparatively better than athletes of 20 years ago.

The above boxplots demonstrate the relationship between the first-place finishing times for 100 mile races and the max temperature from race day. The 30-34 degree celsius category (hot!) appears to correspond to slower finishing times.

The above plot exposes the trends in the average speeds of male and female first place finishers over the years. Interestingly, average speeds of both groups is steadily decreasing. The plot does not account for distances, an increase in longer events may be responsible for this trend.

This plot displays the average difference in speed between male and female athletes given race distance. As the race gets longer the gender speed disparity decreases.
See linked code for creation of visuals: