
Decision trees
Overview
A decision tree algorithm is a supervised machine learning technique used fro classification. In the context of the ultra-running data the algorithm will be used to predict the distance of the race given input features. A decision tree algorithm operates similarly to a flow chart. The tree begins at the “root node” then based response to this node - say if an athlete is male or female - the algorithm moves down the tree to the next node / question. The process attempts to quickly reach a “terminal node” at which point every response that flows down to this node must have the same classification.
When creating a decision tree algorithm gini, entropy, and information gain are applied to best separate data and lead to pure terminal nodes. When determining a good split (i.e. asking meaningful questions at nodes), entropy is used to calculate how impure the dataset remains after the split. By reducing entropy at each decision point the model approaches pure terminal nodes. The related concept of information gain represents the reduction in entropy before and after a node split (decision point). In other words, as entropy decreases through splitting, the information gained increases. The algorithm selects features at each node that maximize information gain. Alternatively, the Gini impurity measures how often a randomly chosen sample would be incorrectly classified if it was randomly labeled according to the class distribution in the node. The concept attempts to illuminate how impure a node (decision point) is. By using this method of tree creation each node is chosen to minimize the weighted average Gini impurity and therefore minimizing the likelihood of misclassification. Both entropy/information gain and Gini impurity are effective ways to build a simple yet accurate decision tree.
In theory it is possible to create an infinite number of decision trees. This occurs as there are countlelss possibilities when splitting data, especially when dealing with continuous data. For example, in the context of the ultrarunning dataset: finishing time is continuous. In theory a decision point could be did the athlete finish faster or slower than 19:52:13 then the next decision could be did the athlete finish faster or slower than 19:52:13.3. As such it is crucial to pick the correct decision points through the criterion discussed above.
As with other supervised learning models such as Naive Bayes and Logistic Regression the data is split into training and test sets. The training set (typically around 80% of the data) is used to train and build the decision tree. Once the tree has been constructed the performance of the algorithm is assessed by its ability to predict the correct classifications for the test set data. It is crucial that the training and test datasets be disjoint to accuratley judge the performance of the model on previously unseen data.
Small Example Using Entropy and Information Gain to measure “goodness” of fit
Using the below dataset:


Basic example of a decision tree

Small Splitting Example
Data Preperation
To prepare the data for the decision tree algorithms the same dataset that was previously created for multinomial Naive Bayes and for Logistic Regression was used to create three decision trees. The data label is the race distance, corresponding to either a 50 mile race or a 100km race.
As mentioned above the data had to be split into disjoint training and test sets to accurately assess model performance. For this analysis 80% of the responses were dedicated to the training set and the remaining 20% (1,820) were assigned to the test set.

Snipit of Training Data
Additionally another tree was created using the dataframe and training and test sets previously used for categorical Naive Bayes.

Snipit of Cleaned Dataset

Snipit of Test Data

Snipit of Dataset for Categorical based Tree
Results
Gini Impurity Based Decision Tree
The first decision tree created used the numeric and continuous feature dataset applied to multinomial NB and logistic regression. Furthermore, this tree applied the Gini Impurity Criterion.
This decision tree algorithm performed exceptionally well boasting an accuracy score of 99.9%. As seen in the confusion matrix the algorithm only mislabeled one response from the 1,820 in the test set. This model far outperforms all of the Naive Bayes and logistic regression models tested with the exact same data. The only mislabeled response was inaccurately labeled as a 50 mile race (80km), as discussed in the Naive Bayes section, multiple other models exhibited bais towards predicting the shorter race class.

Visualization of Gini Impurity Decision Tree

Confusion Matrix for Entropy based Decision Tree
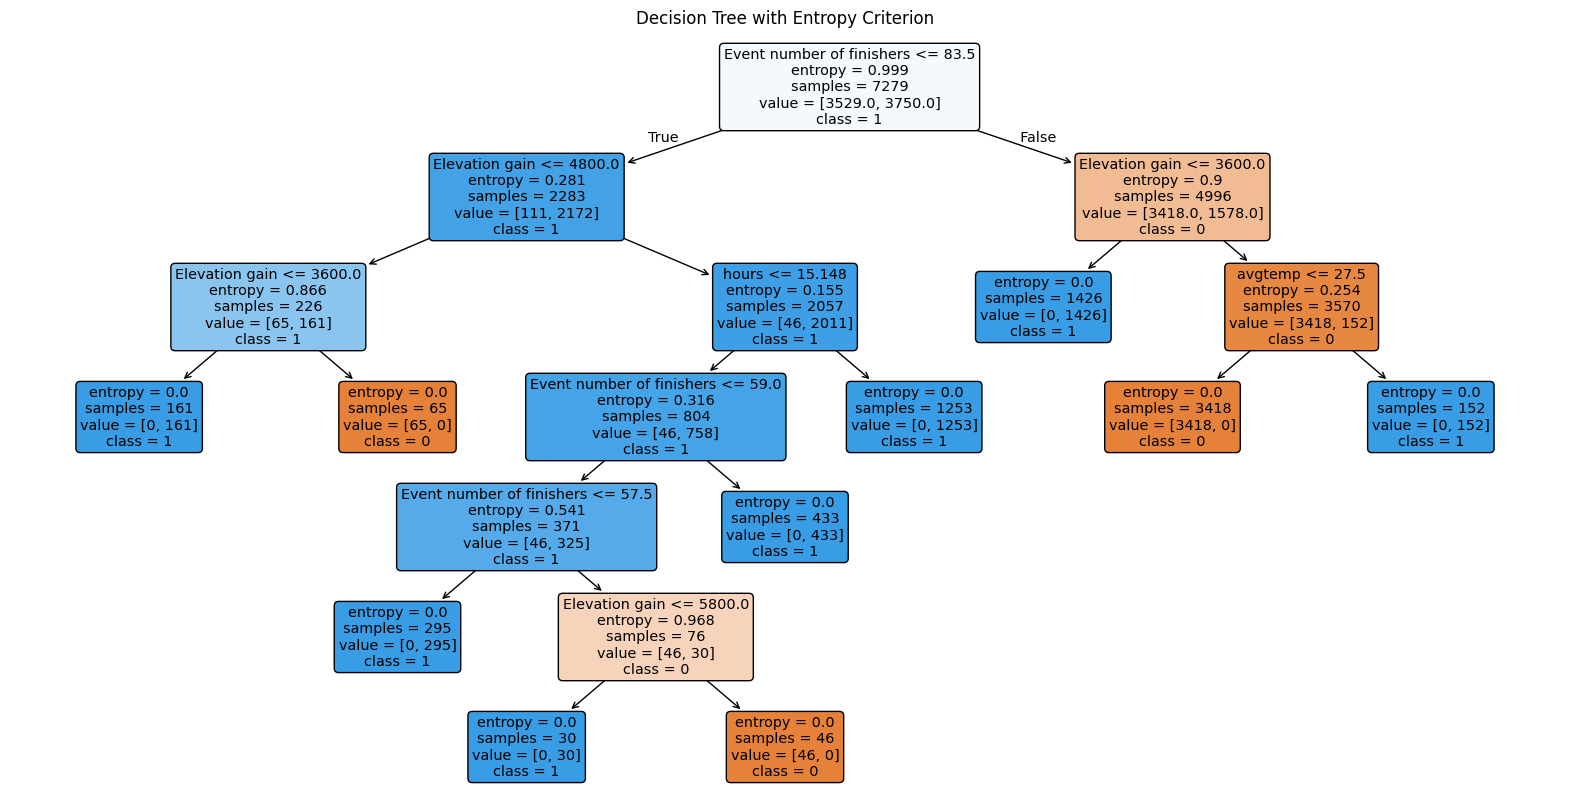
Entropy Based Decision Tree
The second decision tree created used the same dataset as above but applied an entropy based criterion.
This decision tree algorithm even outperformed the previous with a perfect accuracy score of 100%. As seen in the confusion matrix the algorithm accurately classified all 1,820 items in the test set, not mislabeling even a single race result.
Furthermore, as seen by the visualization of the tree (below) the entropy based decision tree has a much simpler structure when compared to the Gini based tree, reaching terminal nodes with less steps.
Visualization of Entropy Decision Tree
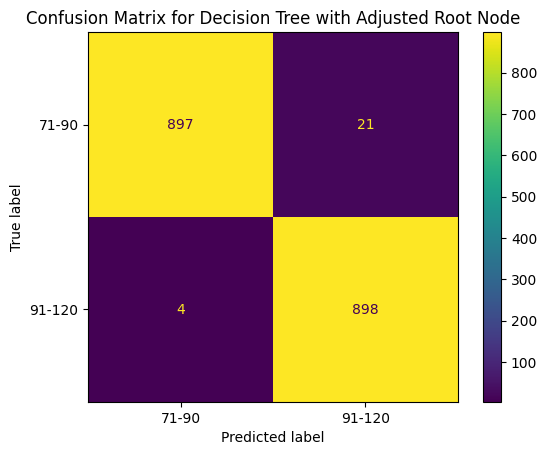
Confusion Matrix for Root Adjusted Decision Tree

Zoomed in Segment of Root Adjusted Decision Tree (above)
Root Adjusted Decision Tree

Confusion Matrix for Categorical Decision Tree

Confusion matrix for Gini Impurity Decision Tree
Forced Root Node - Gini Impurity Tree
The third decision tree created used the same dataset and the Gini Impurity critereon but was forced to use an alternative root node. Instead of using “Event number of finishers” to begin the tree “Elevation gain” was used
This decision tree algorithm performed worse than the previous two with accuracy score of 98.6%. As seen in the confusion matrix the algorithm misclassified 25 of the 1,820 items in the test set. Surprisingly, this alteration created a bias towards the longer race classification (100km) a bias not seen in previous models.
Furthermore, as seen by the visualization of the tree (below) and the zoomed in segment, the adjusted root node decision tree has a significantly more complex structure than either of the previously created trees.

Categorical Gini Impurity Tree
The fourth decision tree created used the same dataset that was used when performing categorical Naive Bayes and implemented a Gini Impurity criterion. This fourth tree also applied a different root node: “hours category”
This decision tree algorithm performed the worst of the 4 trees analyzed and had an accuracy score of 87.6%. As seen in the confusion matrix the algorithm misclassified 225 of the 1,820 items in the test set. This model also exhibited the bias previously noted for other model types, over predicting the shorter race classification.
Furthermore, as seen by the visualization of the tree (below) and the zoomed in segment, the categorical decision tree has an extremeley complicated tree structure.

Visualization of Categorical Decision Tree
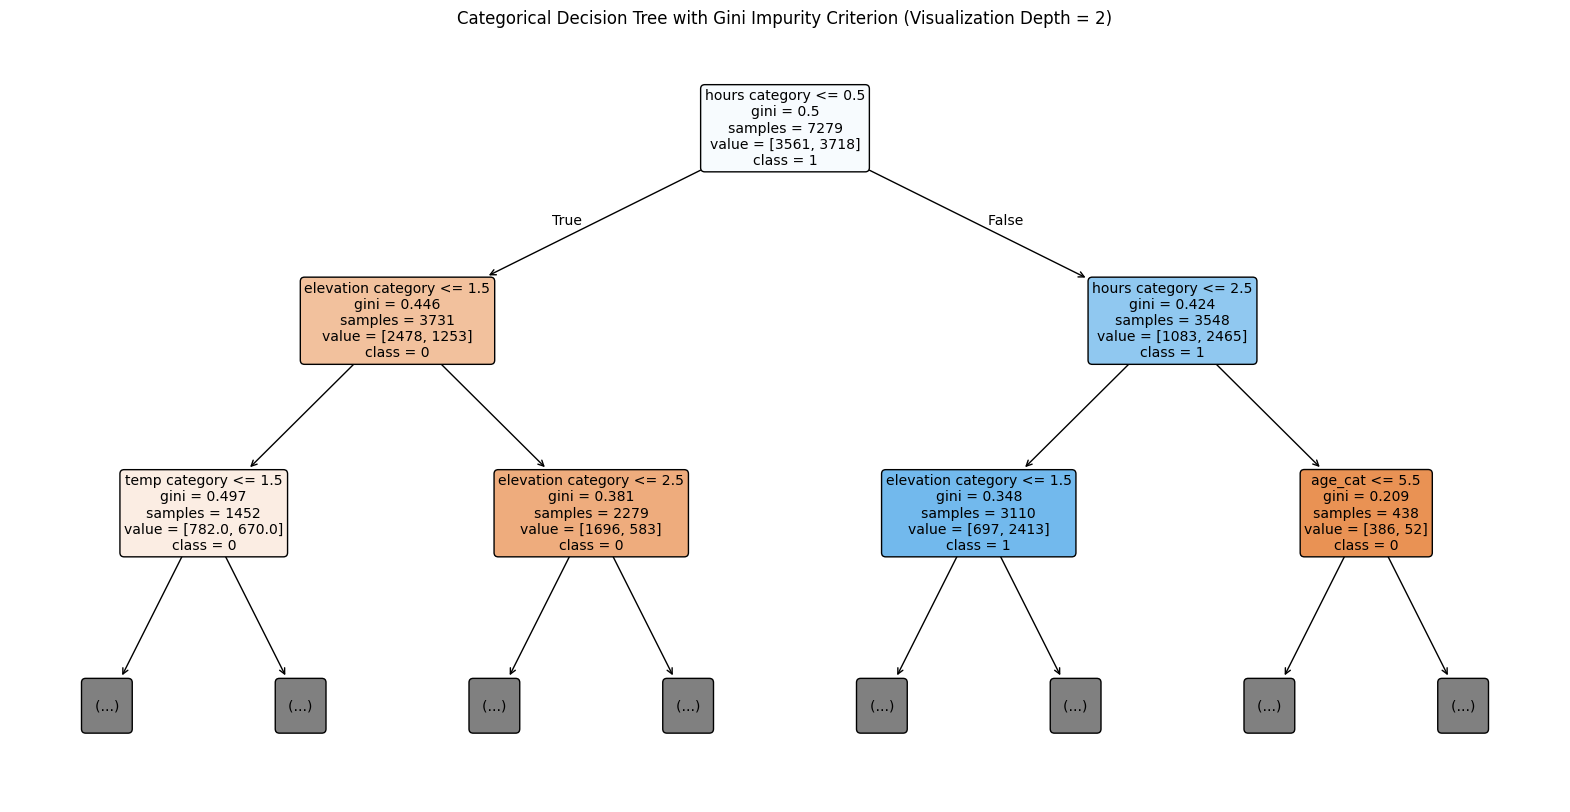
Visualization of Categorical Decision Tree (Visualization Depth = 2)
Summary of Conclusions
As mentioned above, the decision trees created - specifically the Entropy based tree - far outperformed all of the Naive Bayes and logistic regression models used to classify the same dataset. The Entropy based tree had perfect classification of the test set data. Upon first glance, the decision tree has a high probability of accurately classifying race distances of additional independent datasets.
After applying critical thinking of the assessed topic this makes logical sense. Decision trees are capable of capturing nonlinear, hierarchical, and interaction-based patterns amongst features while the other model types assume more rigid relationships. As a result the data lent itself to be most accurately interpreted by this approach. Given that each race has many athletes present, if a race had athletes in both training and test datasets (as would be expected by the random assignment of training and test sets) the decision tree would likely make an accurate classification. Therefore, it is highly likely that the decision tree has overfit the data and could perform worse than the other models given large instances of new data.
Further valuable feature information such as race course surface could potentially help the overfitting issue and enable the tree to make continued accurate predictions.